
The maps an evaluation can use, and what each one answers.
Interviews and surveys tell you what changed. Maps and satellite images show where, for whom, and how much. Here are the main types I use, with the evaluation questions they help answer.
QGIS, free and open source
Open satellite and humanitarian data
Seeing what is happening where, and starting to understand why
Using maps in evaluation goes beyond looking at an image. A map links what is happening to where it is happening, and often helps explain why.
A gap in coverage next to a damaged road, crop health falling in the villages furthest from water, results that differ from one district to the next: patterns like these are hard to spot in a table and obvious on a map. Maps are a strong alternative to tables and long text, showing geographic data in a way decision-makers can take in at a glance and discuss together.
- Answer key evaluation questions across sectors: food security and livelihoods, water and sanitation, shelter, health, education, protection, disaster risk reduction and climate adaptation
- Account for nature as a stakeholder by tracking vegetation, water and land use, so environmental effects are part of the judgement, not an afterthought
- Bring context into the analysis: hazards, access, conflict and displacement all shape what a programme can achieve
- Check coverage and equity: who was reached, who was missed, and whether support matched need
- Fill gaps where insecurity, distance or budget limit field visits, and compare before and after when no baseline was collected
- Leave something behind: maps and data your team can update and reuse once the evaluation is over
Eight kinds of analysis for an evaluation
All of these can be done with free, open-source QGIS and open data, and handed over to your team afterwards.
Results by area
Shade districts or communes by an indicator to see where targets were met and where they fell short.
Example question Did results differ between regions?
Coverage and gaps
Plot activity sites against needs and population to show who was reached and who was missed.
Example question Did support go where it was needed most?
Distance and access
Draw buffers or travel-time zones around schools, clinics or water points to measure how far people travel.
Example question How far do people walk to the nearest clinic?
Hotspots
Turn hundreds of points, such as incidents, referrals or survey answers, into clusters that show where issues concentrate.
Example question Where are protection incidents clustered?
Change over time
Compare satellite images from different years (for example vegetation, water or built-up areas) to see what changed on the ground.
Example question Did tree cover recover after the programme?
Hazard exposure
Overlay flood, drought or cyclone layers on settlements and infrastructure to show who is most at risk.
Example question Were the most exposed villages prioritised?
Fair sampling
Select survey and field-visit sites at random or by group, so the evaluation covers the whole programme, not only the easiest places to reach.
Example question Which sites should we visit?
Combining layers
Bring several datasets together (livelihood zones, displacement, markets, partners) to see how context shapes results.
Example question Does the programme match how people make a living?
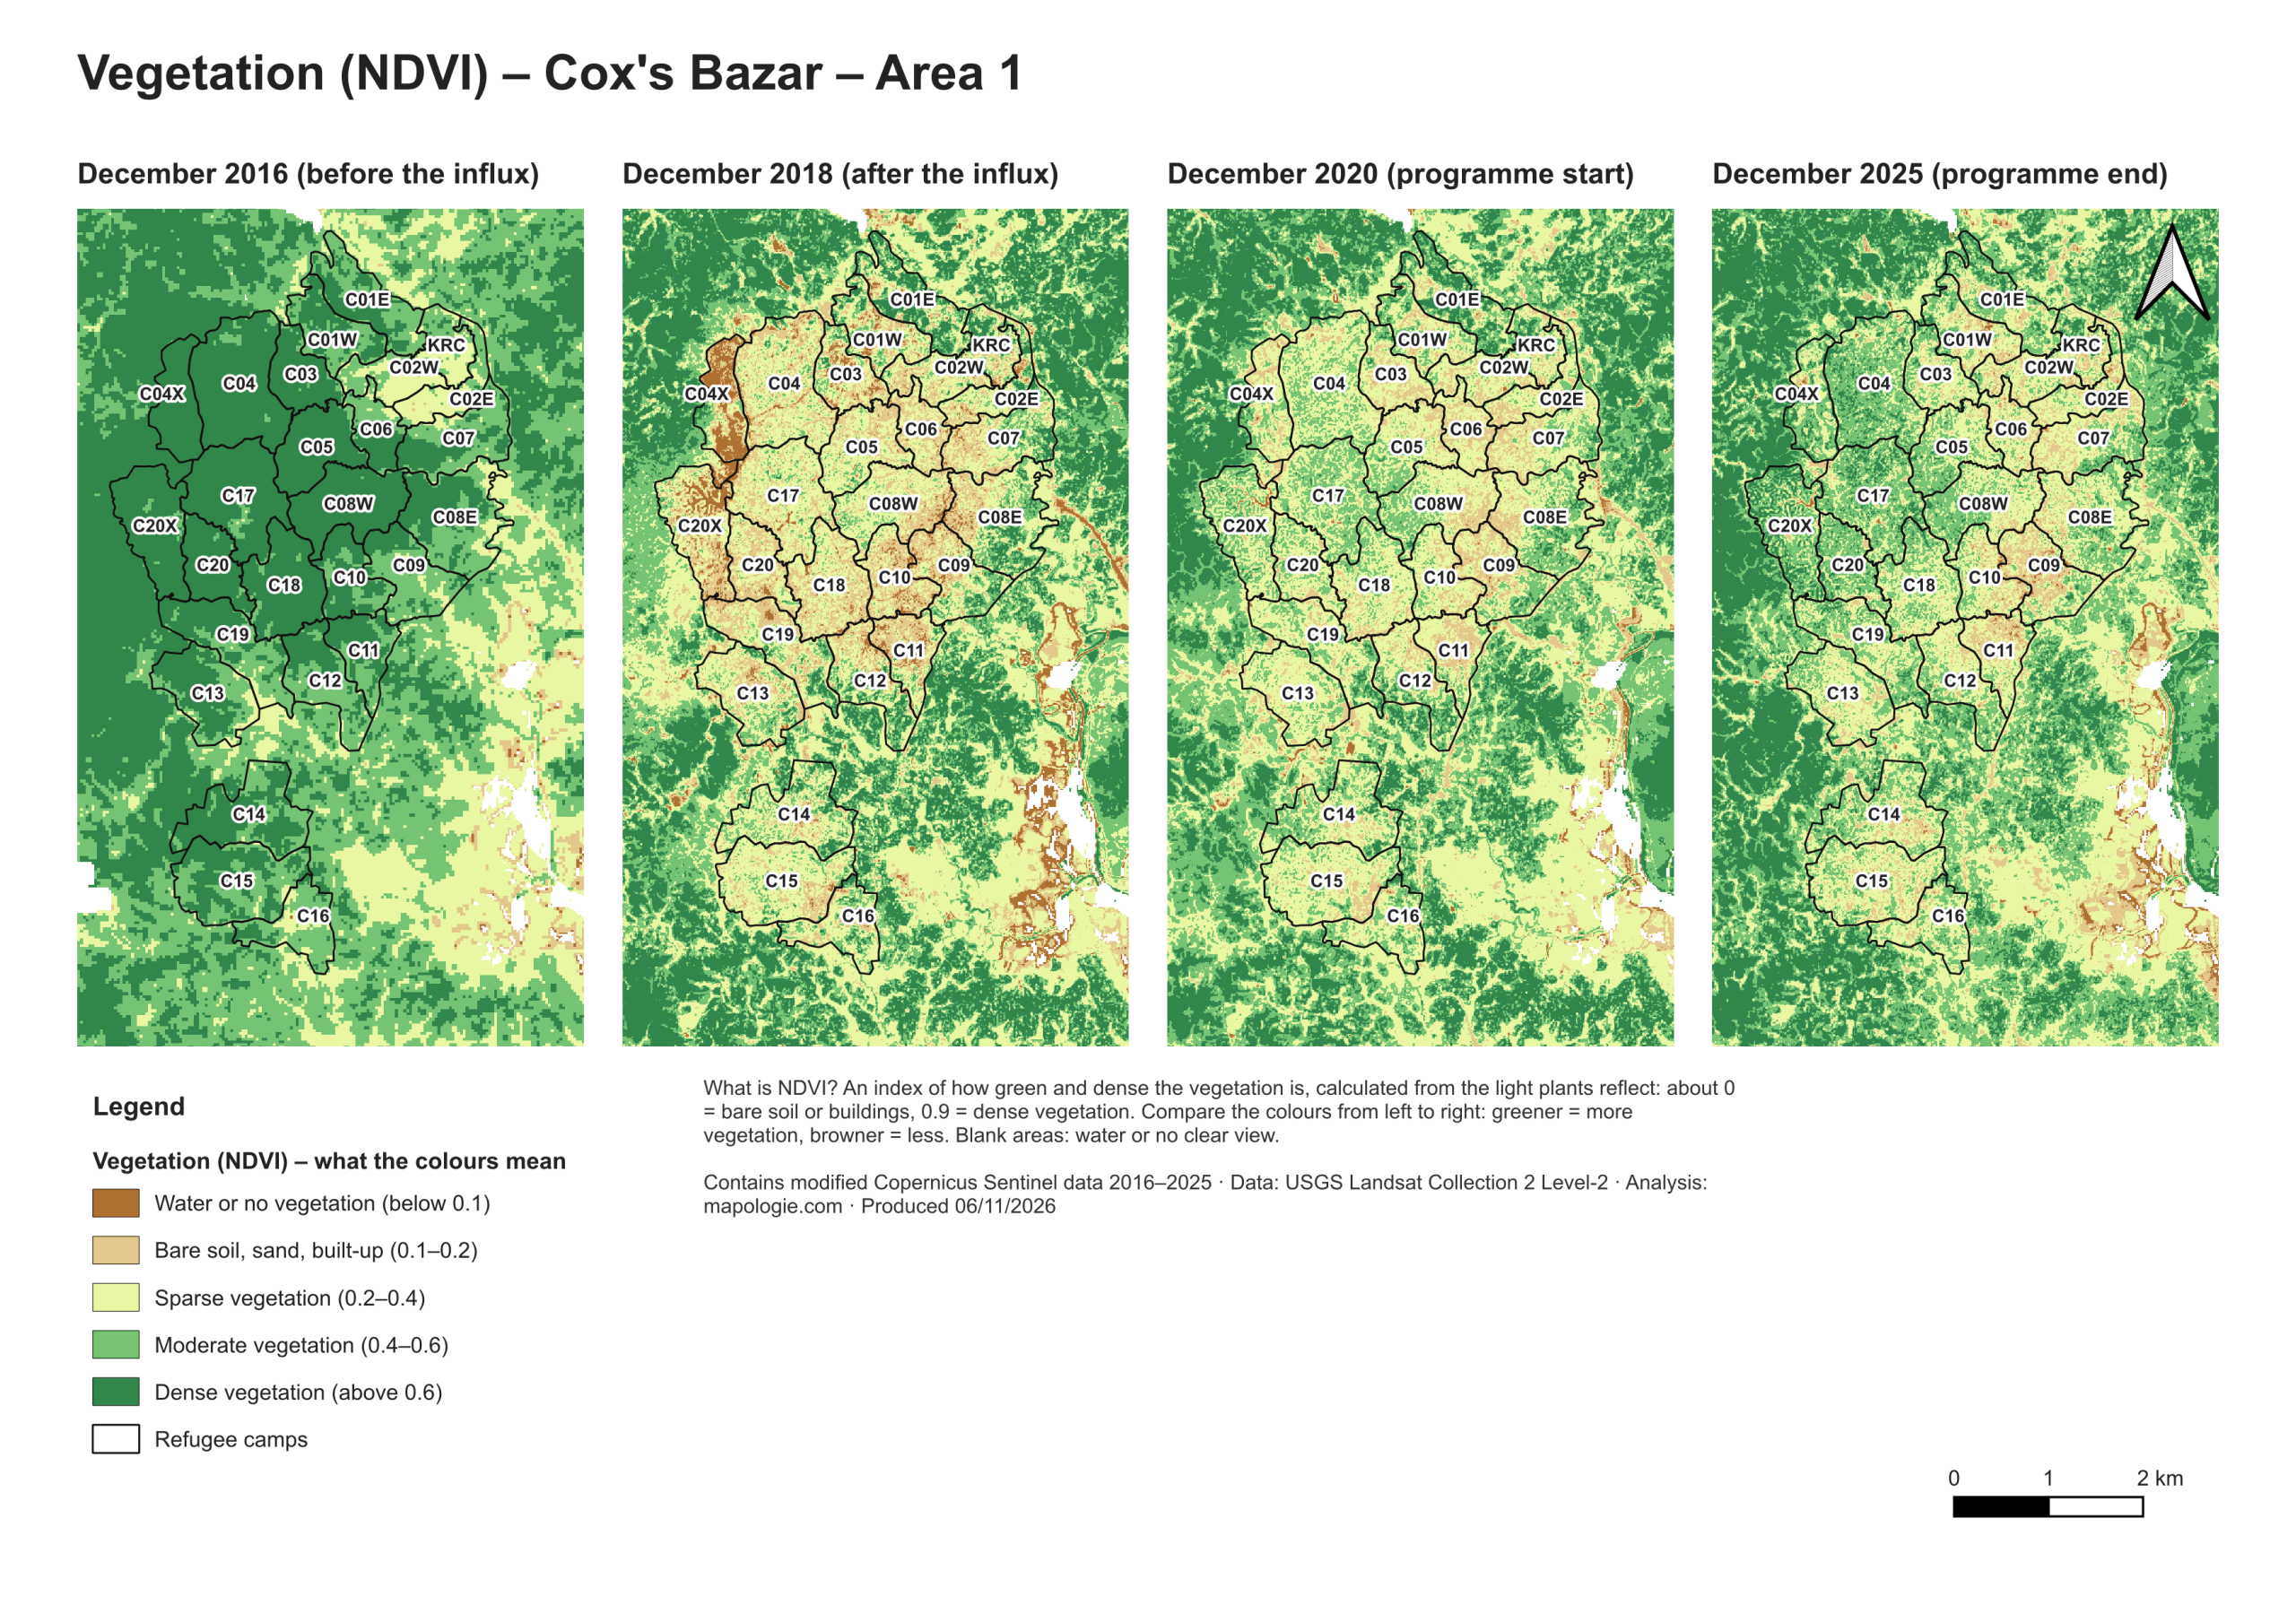
Tracking vegetation in and around refugee camps (NDVI)
NDVI (Normalised Difference Vegetation Index) uses satellite images to measure how green and dense vegetation is, from about 0 for bare soil or buildings to 0.9 for dense forest.
For the refugee camps of Cox’s Bazar Area 1, I compared four moments: before the 2017 influx (December 2016), after it (December 2018), and the start and end of a programme (December 2020 and December 2025). The maps show how much tree and plant cover was lost as the camps were built, and where it has started to come back.
A camp-by-camp picture of change
- Across the whole area, vegetation rose slightly over the programme period (average NDVI +0.02)
- The strongest greening was in Camps 4, 4 Extension, 20 and 20 Extension (+0.12 to +0.13)
- Camps 1E, 1W and 9 lost vegetation, so they are the places to look at more closely
- Most other camps stayed about the same
Results like these give an evaluation a way to check environmental outcomes camp by camp, and to choose where field visits and interviews should focus.
Images from above need checking on the ground.
- Satellite findings are always cross-checked with interviews, field visits and programme data
- Maps never show individual households or anything that could put people at risk
- Location data is anonymised and shared only as agreed with you
- I’m clear about what the imagery can and cannot tell you, such as cloud cover or image resolution
Planning an evaluation, a MEL system or a QGIS course?
Tell me what you’re working on and when you need it. I’ll reply with how I could help.